The QuickScan tool is part of the ECOPLAN - toolbox. In addition to the tools for participation and consultation, ECOPLAN also developed the ECOPLAN SE "Scenario Evaluator", a spatial explicit tool for the evaluation of ecosystem services (18). The QuickScan was initially developed as a post-processsing module and can be used to summarise and compare scenarios (a before and after situation). The main purpose is to provide insight in potential changes at project area level.
However, the QuickScan can also be used to compare ecosystem services delivery between study sites. End-users often wanted to know which ecosystem services are currently supplied by (green) open space in Flanders. Which provinces, municipalities etc. are good at supplying certain ecosystem services? An answer to these question can help to develop a policy where we take ecosystem services into account . We accomodated this request by applying the QuickScan to the Flemish Dataset.
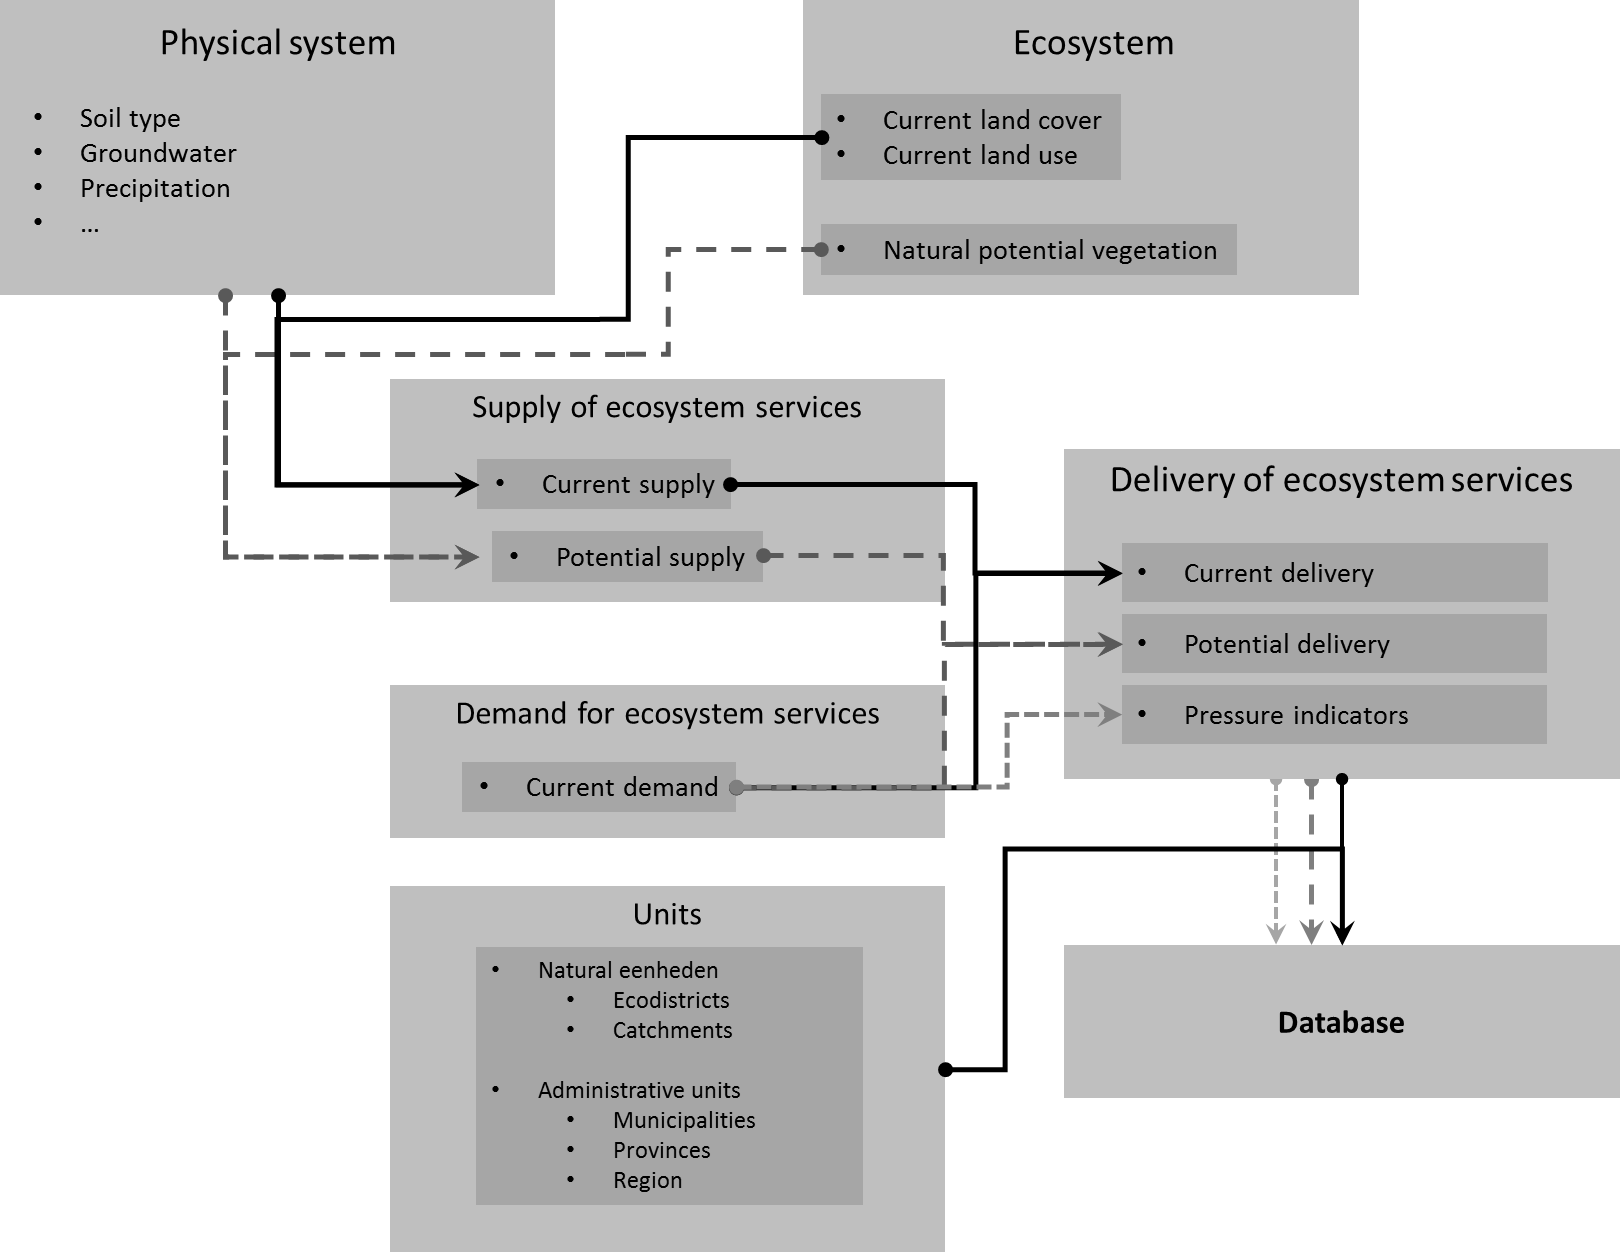
First, the ECOPLAN SE "Scenario Evaluator" was used to assess the ES-supply of Flanders for the current situation. The resulting ES-maps and key input maps are available on www.ecosysteemdiensten.be/geoloket. The QuickScan was then used to summarize the supply of ecosystem services at the level of administrative demarcations. The resulting tables, derived from the maps, provided a quantitative and monetary valuation of ecosystem services for specific study areas, municipalities, provinces, etc. The initial output only provided information on the supply of ES and associated monetary valuation.
Yet, the interpretation of this information was still difficult and often led to adverse conslusions. A first issue, is that the delivery of some ecosystem services is strongly determined by demand. A second issue is that many abiotic factors that cannot be altered or managed. Consequently, both the demand for ESD and the (potential) supply vary spatially in Flanders. This results in large variances due to a difference in demand, supply or both.
For example, a low quality green area in a densely populated area will still attract more visitors than a high quality green area in a sparsely populated region. In the case of water provisioning, the importance of infiltration will depend on the presence of groundwater abstractions. From these examples it is clear that a high ES-supply is not neccesarily the result of good land stewardship, but is largely driven by other factors.
Based on such insights, additional indicators have been developed that indicate how "performant" a municipality is in the delivery of a particular ecosystem service. In performance evaluation the delivery of services is taken into account, but the need or demand for a particular ecosystem service and the intrinsic capacity of an area to provide a particular service. For example, in heavily populated areas there may be a huge need for additional green areas for recreation. In the case of carbon storage in the soil there are intrinsic limitations. For example, the carbon storage in a dry sandy soil will naturally be very limited and the potential is therefore lower than in other areas. This type of information can help determine the extent to which protection is needed and/or development of additional greenery and to what extent there are opportunities to further strengthen the supply of certain ecosystem services.
The absolute amount of "ecosystem services" is not always the most important, the extent to which there is a healthy balance with demand and potential delivery, the more.
With these indicators, one can check to what extent a municipality scores better or worse for the different ecosystem services compared to other municipalities. This information can help determine the extent to which the protection and / or development of additional green space is needed and to what extent there are opportunities to strengthen the delivery of ecosystem services.
The QuickScan database is available as an Excel file and has been provided with an accompanying document. For the various ecosystem services, delivery in Flanders was spatially aggregated at the level of different nature-related (ecodistricts and river basins) and administrative units (region, province, municipality). With this database, the different areas can be compared and it is possible to check which areas in Flanders supply which ecosystem services. Based on the results, it can be determined whether an area performs better or less well in relation to surrounding areas and how this is achieved.
Illustration of the data processing workflow - transforming spatial explicit maps (pixels) to aggregated data (municipalities, catchments, etc.)
The final database is made available as an excel file containing the aggregated data and a user interface with tables and infographics that allow to compare two sites (or scenarios). It contains information on total ES-supply, ES-supply per area unit, ES-supply relative to potential (if relevant), ES-supply relative to demand (environmental pressure indicators) and ES-supply expressed in alternative units (e.g. olympic swimming pools for water retention). A user interface allows to select study and reference areas (or scenarios). The information is then visualised in tables and infographics that allow to compare two sites (or scenarios).
=>A typical output table with results of the quantification for a study area.
=> Relative differences (%) in ESD delivery (quantitative data per ha non-urban) between a study area and a reference area.
The excell database has also been linked back to the GIS-dataset for the administrative demarcations of municipalities (the shapefiles). This allows to map various aspects of Es-supply at the municipal level for the Flemish region.
Download shapefiles: watervoorziening_uit_grondwater.zip; voedselproduktie.zip; vermeden_erosie.zip; verkoeling_door_groen.zip; N-bodem.zip; recreatie.zip; waterretentie.zip; nitraatverwijdering.zip; kwaliteit_woonomgeving.zip; koolstofopslag_in_bodems.zip; koolstof_in_biomassa.zip; infiltratie.zip; houtproduktie.zip; gezondheidseffecten_open_ruimte.zip; geluidsattenuatie.zip; P-bodem.zip; captatie-fijn-stof.zip; Bestuiving.zip
We illustrate the use of this dataset with three practical examples.
The first example is “carbon storage in the soil”. This storage can contribute to a climate-neutral Flanders and thus contribute to the global climate objectives. The potential for building up carbon in the soil is largely determined by soil properties and the management of the soil. We determine the performance by comparing the current carbon storage in the soil with the maximum achievable. This shows that the municipalities with a considerable share of forest and marsh score high. Despite the fact that polder soils naturally have high carbon storage, there remains a huge potential for improvement through adapted water management and conversion of arable land to forest or grassland. In urbanized areas, reducing the paved surface in strategic locations has great potential.
Figure 1: Carbon storage in the soil - Current storage in relation to the potential storage under natural vegetation (naturally occurring forest types). For the legend, the municipalities were divided into 5 equal groups based of the indicator.
A second example is “Health effects of green open space”. The proximity of greenery in the immediate living environment (incl. grasslands and fields) has a positive effect on the prevention against many diseases such as heart failure, depression and anxiety disorders. We express this effect in healthy life years gained, which leads to saved health costs. We calculate the performance on the basis of the number of years of life per inhabitant and thus provide an overview of the availability of green in the vicinity. Larger cities, but also rural municipalities with a limited amount of greenery in the vicinity of residential areas score low on this indicator. Targeted development of greenery near residential areas will improve the health of the inhabitants.
Figure 2: Health effects - Healthy life years per inhabitant due to the presence of environmental green (grassland, forest, fields, gardens, etc.). For the legend, the municipalities were divided into 5 equal groups based on the indicator.
A third example is recreation. Open space has an attraction for recreationists to walk and cycle. Large contiguous recreational areas with facilities and a varied landscape are more attractive to recreational users than small fragmented or monotonous areas. If there are few areas available in the immediate vicinity, one will also visit areas further away. The performance indicator indicates the extent to which municipalities are able to attract recreational visits per inhabitant. A high score means that there are also many visits from people that live outside the municipality. This can be explained by a shortage of green areas in surrounding municipalities and / or by the presence of areas with a high attractiveness due to the size of the area, the facilities or the attractiveness of the landscape. This indicator shows in which municipalities there is a need for additional, high quality recreational green areas.
Figure 3: Recreation - Number of recreational visits per inhabitant as a measure of the amount of green and recreational attractiveness available. For the legend, the municipalities were divided into 5 equal groups based on the indicator.
Transferability and user requirements:
- Skills in GIS, Python and Excel and VBA are required to transfer the approach to other applications
- Depending on the case study, large amounts of spatial explicit data may need to be collected
- The software is coded to run in QGIS. Post-processing scripts need to be run to prepare data for QUICKScan. Software will become freely available by the end of 2017